HOW TO USE TECHNICAL ANALYSIS TO FORM A WEEKLY VIEW A thread🧵 Got many DMs about how I form my weekly view in Banknifty and how do I analyze it. In this thread I'll show you how I do it so that anyone can analyze Banknifty and other instruments the right way.
1: Weekly timeframe One Should start analyzing with a weekly time on candlestick charts.
As you can see there is a clear resistance at 41940 level on weekly charts and a clear support on at 32000 level on the Banknifty chart. Hence this is our bigger term range.

But the previous week's candle is a bearish candle hence our bias for the current week stays sell on rise.
2: Daily timeframe Next step will be to analyse the daily timeframe charts to refine our view further.
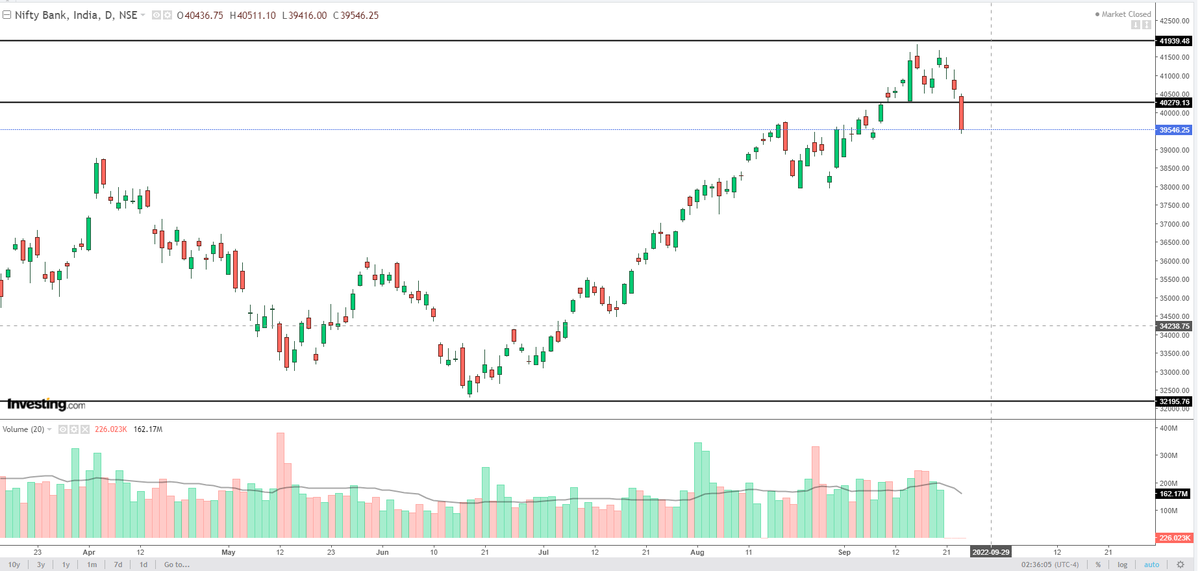
Banknifty was inside a range of 40279 and 41940. However the most recent candle confirmed a breakdown and our bias turned bearish.

This range breakout also confirms our weekly view of bearishness. Slowly we'll start to shift on lower timeframe.
3: Hourly timeframe also confirms with our view

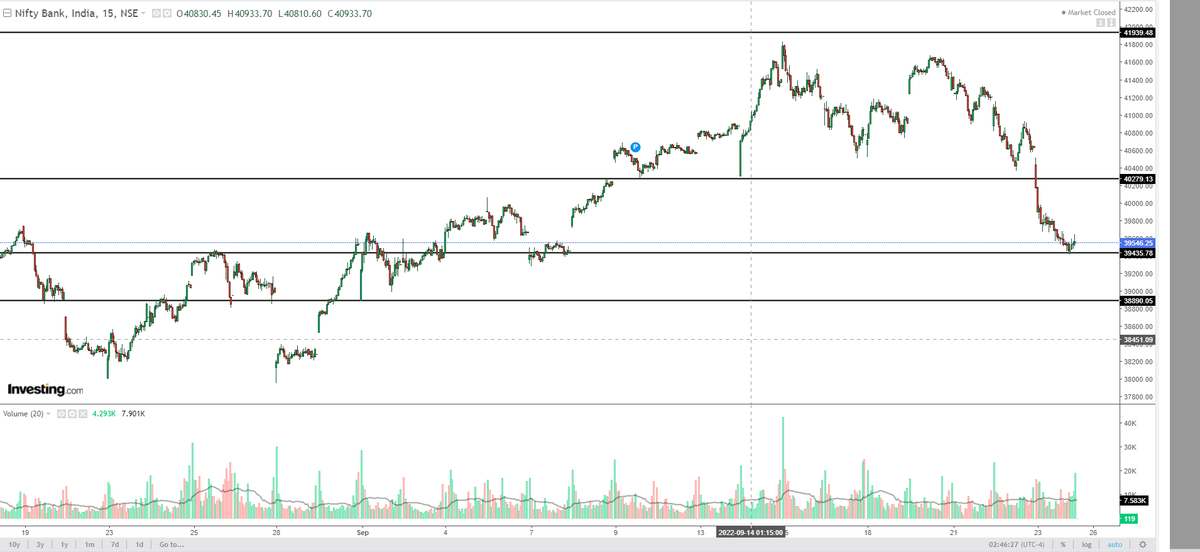
4: The same goes with 15 mins timeframe. So this week as long as Banknifty stays below 40280, it will remain a sell on rise market. One can consider selling calls with appropriate risk management.

5: One thing to note down on 15 min timeframe is that there are multiple supports too. So a dead cat bounce can come anytime and one always has to be prepared for it.

That's it for this thread and I hope you learnt something. Retweet this thread and follow me for more such learnings. Join our free telegram channel for learnings during live markets :
t.me/learnwithdjand…
If you want to learn personally from us then join Inner Circle where we personally interact with you, take live sessions and help you become a better trader. https://t.co/iAdmxyS4ee
rigipay.com/g/dQVOq6njkI?n…
